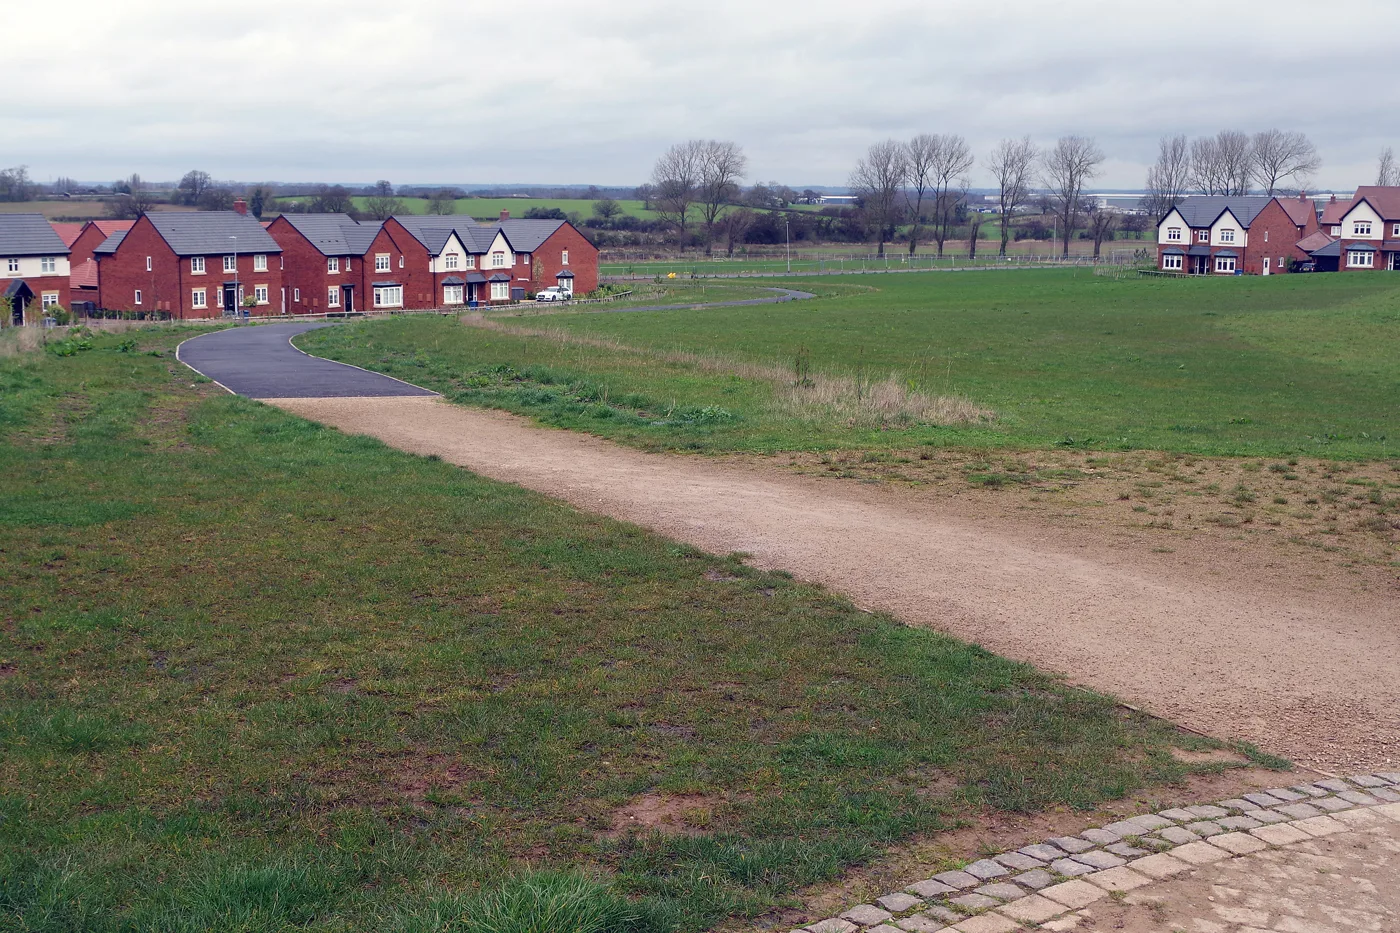

The average Lichfield district home was worth £335,799 in July, up 2.8% in a year. Still Staffordshire's dearest, but flats slipped and Solihull is back ahead.
The average home in Lichfield district was worth £335,799 in July 2026. That is up £9,288, or 2.8%, on July 2025, and 0.4% up on June.
The figures come from HM Land Registry’s UK House Price Index for July 2026, published on 16 September. Lichfield is still the most expensive place to buy in Staffordshire. But the pace has cooled. The 2.8% annual rise is the district’s slowest since January, and a year ago the same figure was 5.8%.
A note on the number itself. The index figure is a mean average of sold prices, adjusted for the mix of homes sold. It is not a median, so a handful of large sales pull it upwards, and a typical sale in the district is below it.
Still the dearest in Staffordshire
Lichfield’s average is £24,937 above South Staffordshire, at £310,862, the county’s second most expensive area. It is £85,166 above the Staffordshire average of £250,633, and £42,320 above England’s £293,479.
Growth is a different ranking. Of Staffordshire’s nine local authority areas, Lichfield sits joint sixth with Cannock Chase, both on 2.8%. Staffordshire Moorlands rose 7.1% and Newcastle-under-Lyme 6.6%, from much lower starting prices. Tamworth and Stoke-on-Trent both fell.
Across England, the district’s 2.8% was the 107th highest annual change of the 295 local authority areas. Prices fell over the year in 85 of them. England as a whole rose 1.1% and the West Midlands region 1.5%.
Solihull is back in front
Our June report said Lichfield was dearer than Solihull. On the first estimates published in August, it was. The revised figures say otherwise, and July confirms it:
| Area | Average price, July 2026 | Change on July 2025 |
|---|---|---|
| Solihull | £337,112 | +3.3% |
| Lichfield | £335,799 | +2.8% |
| Bromsgrove | £335,607 | +2.3% |
Three very different places now sit within £1,505 of each other. Solihull is £1,313 ahead of Lichfield, and Bromsgrove only £192 behind.
What each type of home costs
| Type | Average price, July 2026 | Change on July 2025 |
|---|---|---|
| Detached | £521,001 | +2.6% |
| Semi-detached | £314,921 | +3.8% |
| Terraced | £250,381 | +3.3% |
| Flat or maisonette | £162,126 | −0.1% |
| First-time buyer | £265,560 | +3.1% |
Semi-detached homes rose fastest, as they did in June. Flats are now the one type falling, down 0.1% on the year, having been up 1.9% in the first June estimate. That makes the cheapest route into the district the only part of it getting cheaper, though the change is small enough to reverse in a revision.
June has been revised down
The first estimate for June, which we reported in August, was £337,052, up 3.9%. The Land Registry has now revised June to £334,519, up 3.1%, a cut of £2,533.
That is normal. The index is built from completed sales, and sales for any month keep being registered for weeks afterwards, so a first estimate is provisional. The revision also moved the district’s highest recorded average. It is now March 2026, at £337,720. July is £1,921 below that.
What it means for you
- If you are selling, prices are still rising, just more slowly. The district average is within about £2,000 of its March peak.
- If you are buying your first home, the figure to use is £265,560, the first-time buyer average, rather than the £335,799 headline.
- If you are buying a flat, the average has stopped rising. At £162,126 it is less than a third of the detached average.
- If you are comparing areas, Cannock Chase averages £236,743 and Tamworth £229,251, which is £99,056 and £106,548 below Lichfield.
- Treat July as provisional. On this month’s evidence, it could move by a few thousand pounds when August is published.
Sales counts run two months behind. The latest, for May 2026, recorded 68 sales in the district, against 115 in May 2025. Small monthly counts are one reason a district figure swings more than the national one.
The next release, covering August, is due in October. Our house prices page has the longer picture for the district, and our planning news tracks the schemes, including the Local Plan 2046 consultation, that will decide how many new homes get built.
Sources
- HM Land Registry, UK House Price Index for July 2026, published 16 September 2026.
- UK House Price Index full data file, July 2026 for the district figures, the property type splits, the first-time buyer average, the sales counts, the revised June figure, the March 2026 peak and the ranking of all 295 English local authority areas.
- UKHPI data for Lichfield, July 2026 and the equivalent records for the other Staffordshire authorities, Solihull, Bromsgrove, the West Midlands region and England.
Figures are averages for the whole of Lichfield district, which includes Burntwood, Alrewas, Shenstone, Whittington, Fradley and Fazeley.
Have your say