
Lichfield's claimant count rose by 95 in August to 1,565, the highest since February 2025, and under-25s hit 365, the most since July 2021.
The number of people claiming unemployment-related benefits in Lichfield district rose by 95 in August, to 1,565. That is the highest monthly figure since February 2025, and the sharpest jump of any of Staffordshire’s eight districts.
The figures come from the ONS claimant count via nomis, dataset NM_162_1, which was updated with the August data on 15 September.
For Lichfield district in August 2026:
- 1,565 people claiming, 2.4% of residents aged 16 to 64
- up 95 on July’s 1,470, a rise of 6.5%
- up 110 on August 2025, a rise of 7.6%
- 365 claimants aged 16 to 24, 835 aged 25 to 49 and 365 aged 50 and over
The rate of 2.4% is the second lowest in Staffordshire and well below the county’s 2.8%, the United Kingdom’s 3.9% and England’s 4.0%. Lichfield is not a high-unemployment district. What changed in August is the direction of travel.
August is normally the month the number falls
In most years the Lichfield count drops between July and August. It fell in 2014, 2018, 2021, 2023 and 2025. This year it rose by 95, which is the biggest July to August increase in the thirteen years of monthly figures nomis holds for the district.
| Year | July | August | Change |
|---|---|---|---|
| 2021 | 2,230 | 2,110 | -120 |
| 2022 | 1,540 | 1,560 | +20 |
| 2023 | 1,520 | 1,470 | -50 |
| 2024 | 1,590 | 1,620 | +30 |
| 2025 | 1,510 | 1,455 | -55 |
| 2026 | 1,470 | 1,565 | +95 |
One caution on the long run. The claimant count changed shape as Universal Credit replaced Jobseeker’s Allowance, because Universal Credit brings in people who are working but on low earnings and still required to look for more. That is why the 2014 and 2015 levels look so much lower. The month-to-month movements above are comparable; the levels across that boundary are not.
Under-25s are the part that moved
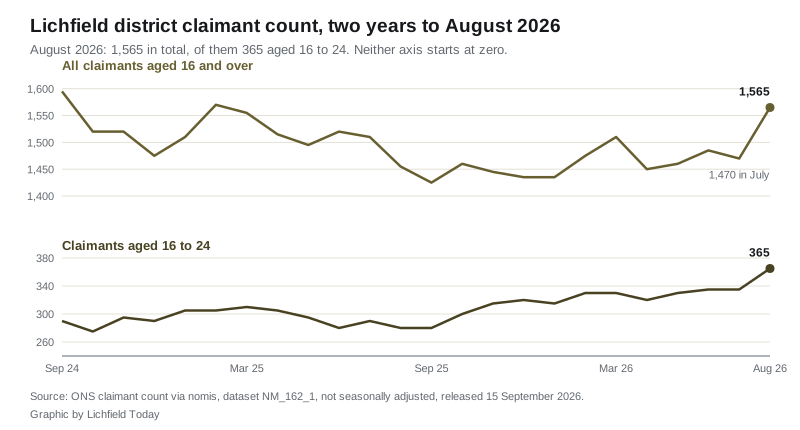
Of the 95 extra claimants, 30 were aged 16 to 24. That takes the under-25 count to 365, up from 335 in July and 280 in August 2025, a rise of 30% in a year. It is the highest figure for that age group since July 2021, when the labour market was still working through the pandemic.
Under-25s are now 23% of all claimants in the district, on a nomis age breakdown that runs back to 2018.
The other two age bands moved less. Claimants aged 25 to 49 rose by 25 to 835. Claimants aged 50 and over rose by 40 to 365, and that group is still slightly smaller than it was a year ago, when it stood at 380.
The ONS does not publish a claimant rate for individual age bands, so there is no official under-25 percentage to quote. The counts above are what the table supports.
How Lichfield compares with the rest of Staffordshire
Every Staffordshire district recorded a rise in August. Lichfield’s was the largest, both as a number and as a share of its own July figure.
| District | Rate | Claimants | Change on July |
|---|---|---|---|
| Staffordshire Moorlands | 2.2% | 1,210 | +40 |
| Lichfield | 2.4% | 1,565 | +95 |
| South Staffordshire | 2.6% | 1,760 | +20 |
| Stafford | 2.6% | 2,185 | +75 |
| Newcastle-under-Lyme | 3.0% | 2,365 | +85 |
| Cannock Chase | 3.1% | 2,025 | +85 |
| East Staffordshire | 3.3% | 2,615 | +50 |
| Tamworth | 3.3% | 1,635 | +55 |
Source: nomis, all Staffordshire districts in one call. Rates are the percentage of residents aged 16 to 64. Counts are rounded by the ONS to the nearest five.
Over the year, Lichfield’s rise of 7.6% is also the steepest in the county, just ahead of Stafford on 7.4%. Two districts went the other way: East Staffordshire is down 100 on August 2025 and Staffordshire Moorlands is down 15.
What the claimant count is, and is not
This is the number that gets called “the unemployment figures” and it is not that. The ONS says so in its own quality report: the claimant count “does not attempt to measure unemployment, which is a concept defined by the International Labour Organisation (ILO) as all those who are out of work, actively seeking work and available to start work”.
What it does measure is “the number of people claiming benefits principally for the reason of being unemployed, based on administrative data from the benefits system”. Since Universal Credit, that includes people who are in work but on low enough earnings that they are still required to look for more. A rise can therefore mean fewer jobs, or lower hours, or a change in who has to keep searching.
One more honesty point. The same ONS report says the Universal Credit part of the count “allows for revisions to the data for one previous month”, so the July figure of 1,470 may itself change when the September data is published. We will say so here if it does.
What it means for you
If your income has dropped, the district council is the body that handles help with council tax, not the DWP. Lichfield District Council runs council tax support and help towards rent, and its benefits section also carries a benefits calculator, the Crisis and Resilience Fund and a Citizens Advice referral.
Council tax support reduces the bill rather than changing the band, so it is worth reading alongside what the bands actually cost in Lichfield.
If you are 16 to 24 and out of work, you are in the group that grew fastest here this year, which is worth knowing when you are told the local labour market is fine. It is fine on the headline rate. It is not fine on the trend for your age group.
The next monthly figures, covering September, are published by the ONS and appear on nomis in mid October.
Have your say